README
Dashbard made by Johan Schwartz
Made for larger screens but it will scale down on mobile.
Hello! Thanks for visiting. If anything looks wierd, let me know! There might also be bugs, still in Alpha! Upcoming changes: Optimization, bugfixes, more data views, more interactive functionality, regression models and projections. Make sure you check out Highcharts! Best regards, Johan Schwartz
Check out Highcharts!
Data Information
| Latest data point from Johns Hopkins report parser (one day behind means up to date!) | |
| Dashboard version: v2021-01-21-62-alpha | |
| Countries of interest: Sweden, China, Finland, Italy, US, Denmark, Canada, Korea, South, India, Spain, Norway, Taiwan*, Iceland, Iran | |
| Threshold: Minimum 10000 confirmed cases or country of interest |
Instructions
| Hover data points for information. | |
| Dragable zoom area in charts. Use to "Reset zoom" to zoom back out. | |
| Use legend on the left side to select and deselect series. |
Global Development
| Active | Confirmed | Recovered | Deaths |
|---|---|---|---|
| 45,751,601 | 110,306,030 | 62,112,831 | 2,441,598 |
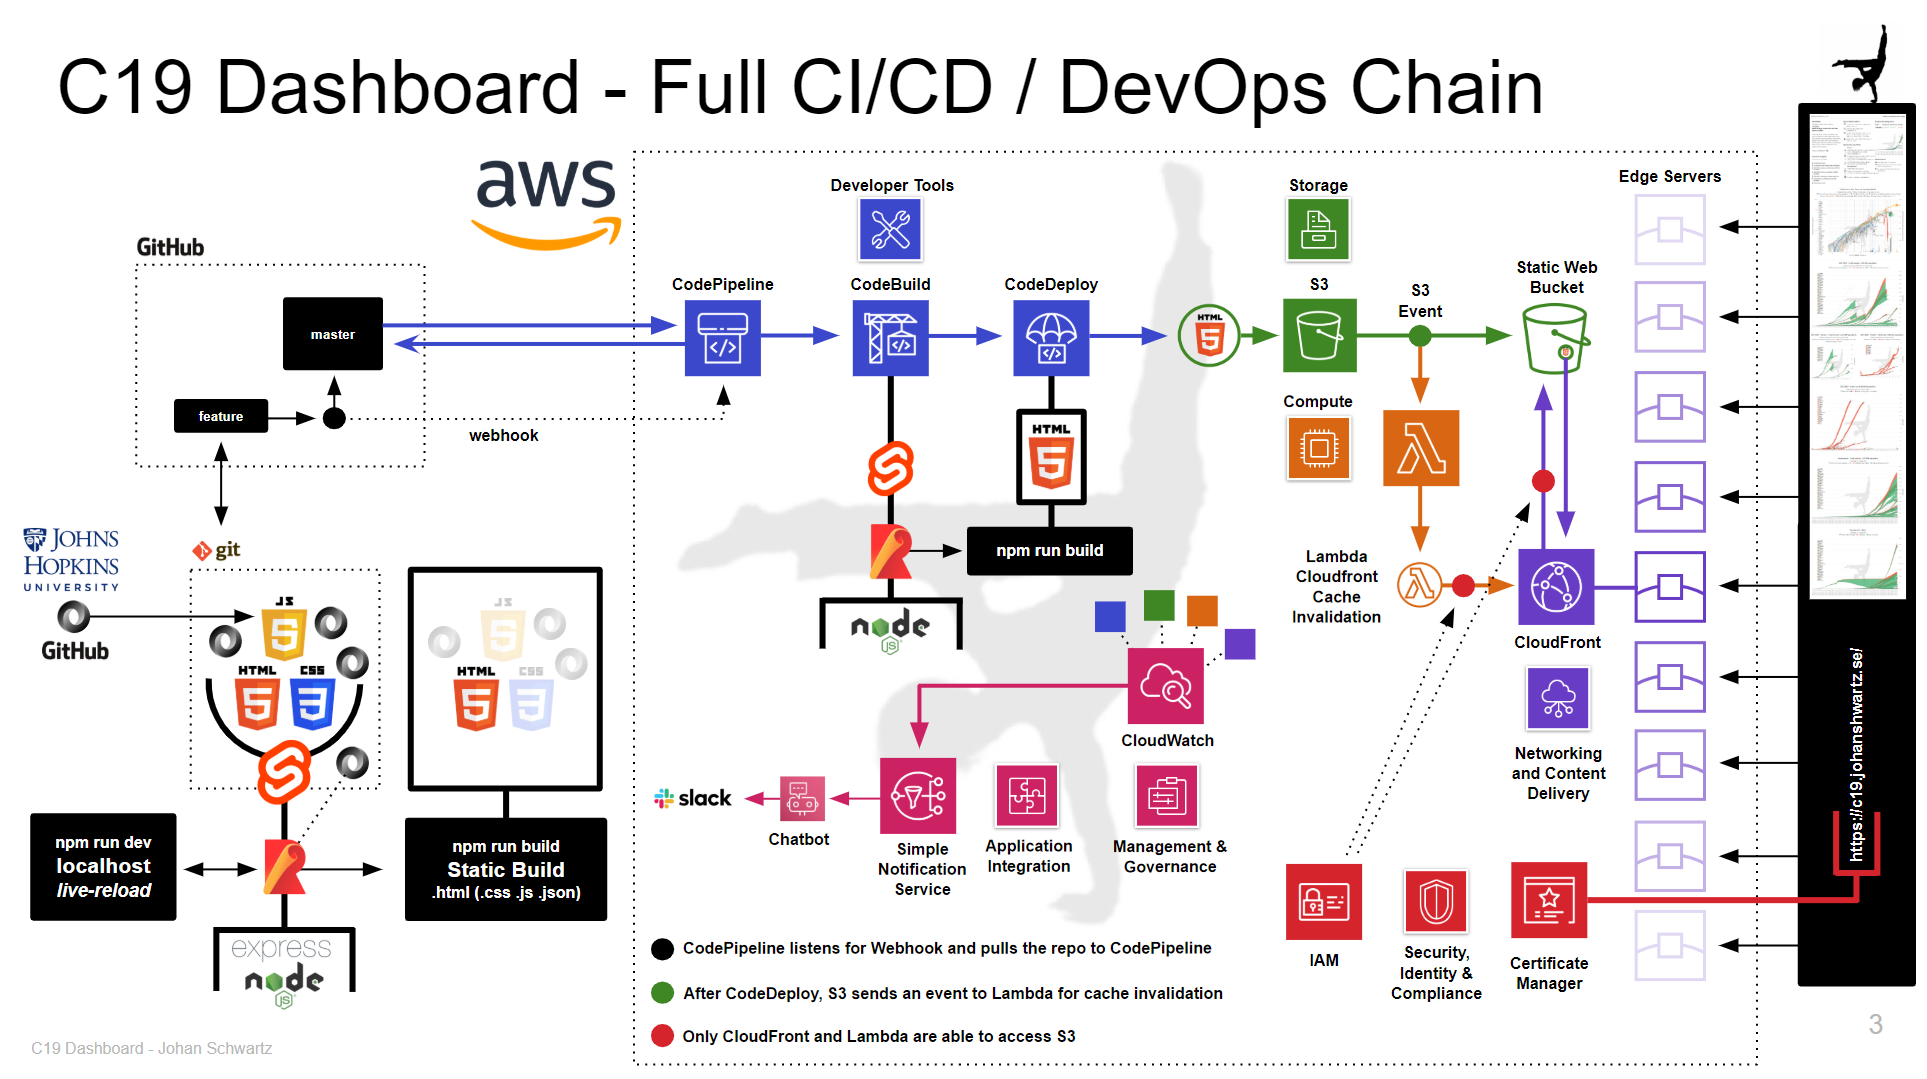
Data Sources Flow
Change Log
- added 14-day delayed colouring
- new scb data
- separated sweden and delay overviews into selectable sections
- separated sweden and delay overviews into selectable sections
- new scb data
- scb data is now showing 2015-2019 avg instead of only 2019
- performance optimizations
- scb data is now showing 2015-2019 avg instead of only 2019
- performance optimizations
- new graph for sweden overview - relative regions
- new graph for sweden overview - age groups
- new section - global dvr
- bug fixes
- many, many, many tweaks and smaller additions to graphs, data, presentation and ui
- new graph for sweden overview - age groups
- new section - global dvr
- bug fixes
- many, many, many tweaks and smaller additions to graphs, data, presentation and ui
- loading indicator for when fhm data is being processed
- sweden overview section added
- bug fixes
- tweaks
- sweden overview section added
- bug fixes
- tweaks
- sweden sections updated!
- other section tweaks
- new data! - icu beds (not sure about the validity of the source data!)
- new data and section! - SCB 2015-2019 and scb 2020 comparison
- menu and navigation tweaks
- bug fixes
- other section tweaks
- new data! - icu beds (not sure about the validity of the source data!)
- new data and section! - SCB 2015-2019 and scb 2020 comparison
- menu and navigation tweaks
- bug fixes
- sweden section updated!
- new graph! - sweden configure
- new graph! - sweden cumulative development
- new graph! - sweden data volatility column
- new graph! - sweden data volatility spline
- many minor fixes and tweaks
- new graph! - sweden configure
- new graph! - sweden cumulative development
- new graph! - sweden data volatility column
- new graph! - sweden data volatility spline
- many minor fixes and tweaks
- polynomial regression integrated
- new configuration options!
- toggle area
- new look for /sweden trying to fix a better relation to FHM data reporting
- fixed some ordering bugs
- united kingdom and germany added to countries of interest
- new configuration options!
- toggle area
- new look for /sweden trying to fix a better relation to FHM data reporting
- fixed some ordering bugs
- united kingdom and germany added to countries of interest
- new section - sweden!
- focused on adding FHM as a data source alongside Johns Hopkins, more charts for sweden can be built
- some tweaks and fixes
- added architecture section
- focused on adding FHM as a data source alongside Johns Hopkins, more charts for sweden can be built
- some tweaks and fixes
- added architecture section
- configurator descriptions and tweaks
- country selector sorting, nordics in alphabetical order on top
- from first range selector, e.g. from the 10th confirmed and death
- minimum confirmed threshold for other countries in comparison
- performance pass planned
- minor ui tweaks
- backlog refinement after feedback
- country selector sorting, nordics in alphabetical order on top
- from first range selector, e.g. from the 10th confirmed and death
- minimum confirmed threshold for other countries in comparison
- performance pass planned
- minor ui tweaks
- backlog refinement after feedback
- new section - configure! explore the data
- minor tweaks and fixes
- minor tweaks and fixes
- rebuild from Svelte to Sapper
- boilerplate progressive web app (service worker)
- preparations for interactivity, not done, direct link cloudfront s3 issue known, fix planned
- every section and graph is now separated into components
- consolidated graphs to the ones that were most meaningful
- significantly! streamlined data parsing and rendering algorithms
- simple new navigation - likely to be changed when more things are added
- changed versioning to be more easy to connect with time!
- fixed all graphs timelines
- backlog refinement
- aws lambda fix
- started making documentation
- initiated refactoring for more performance
- emphasized countries of interest in primary graph
- added better descriptions for graphs
- graph change - graphs related to number of deaths now show from first death instead of confirmed
- started making documentation
- initiated refactoring for more performance
- emphasized countries of interest in primary graph
- added better descriptions for graphs
- graph change - graphs related to number of deaths now show from first death instead of confirmed
- new graph! global
- backlog refinement for next release!
- ux / interface refactoring pass
- linked legend items
- removed font awesome added css gg, performance
- font size tests
- click to go to graph
- clarified data sources
- backlog refinement for next release!
- ux / interface refactoring pass
- linked legend items
- removed font awesome added css gg, performance
- font size tests
- click to go to graph
- clarified data sources
- new graphs! NORDICS
- minor bug fixes
- many tweaks and adjustments
- graph change - fixed relative deaths to count from DAY ZERO
- corrected bug in data parsing
- added Iran to countries of interest
- minor bug fixes
- many tweaks and adjustments
- graph change - fixed relative deaths to count from DAY ZERO
- corrected bug in data parsing
- added Iran to countries of interest
(general)
- new graph! added DAY ZERO graph
- added source flow description
- "total" to "active" in table
- text boxes new layout and information
- graph title changes
- minor bug fixes
- font size adjustments
- updated legend information to be more clear
- updated legend and tried removing countries not in countries of interest list
- min-width fix for lower resolutions
- 1% watermark opacity adjustment
- emphasized last data date
- added Iceland to countries of interest
- added timestamp for when the dashboard was rendered and deployed
(coronaforum)
- new graph! new graph country deaths per million
- spline to line in main chart
- added Taiwan to countries of interest
Architecture
This Dashboard is built using a lot of different techniques and technologies. However, if a potential solution felt too complicated or too much like a hack, it was scrapped. The core philosophies are as follows:
- MVP all the things, iterate
- Convention over configuration
- Keep it simple stupid / Less code is more scalability
- Follow standard patterns
- Automate